How We Test Loudspeakers...
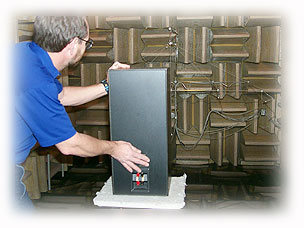
Rene St. Denis sets up a loudspeaker in the NRC's Anechoic
Chamber. All speakers are measured in the same chamber with identical equipment to ensure
consistent and comparable results.
|
Our loudspeaker measurements are
performed by the prestigious National Research Council of Canada. The NRC’s
facilities include a modern anechoic chamber and precision measuring devices, along with
staff with decades of experience conducting these tests. All measurements are performed
separate from the subjective evaluation -- the body of the review.
In all, we perform a total of eight tests
displayed on five charts to give perspective into the measured performance of the
loudspeakers under evaluation.
Measurement distance
All small- and medium-sized loudspeakers are
measured at a distance of 2 meters (6.5 feet). Where appropriate, larger loudspeakers are
measured from a distance of 3 meters (9.75 feet) to allow for proper driver integration.
|
| Chart 1
- Frequency Response and Sensitivity |
Four measurements can be seen on
this chart:
- On-axis frequency response - Measured
directly in front of the speaker face (2 or 3 meters).
Purpose: Shows the forward-firing output of the loudspeaker across the audible
frequency spectrum.
What it tells you: In comparison to the 15 degree and 30 degree measurements we do,
this measurement should be the flattest and have the widest bandwidth. Bandwidth refers to
the upper (highs) and lower (bass) frequencies that the loudspeaker under test will
reproduce. Most good speakers today will extend easily to 20kHz and beyond, although bass
performance will vary widely. Full-range is considered 20Hz to 20kHz, but only the largest
loudspeakers can approach 20Hz and even some very large speakers will not be
"flat" at 20Hz. Many subwoofers cannot reproduce 20Hz at the same sound pressure
level as they reproduce 50Hz. One should recognize that since these measurements are
performed in anechoic chamber, they will generally show less bass than what you can expect
in a real room.
Although all frequency response measurements will have some bumps, in general, good
speakers will have a smooth and even response within its bandwidth without many severe
dips or bumps. Dips indicated less output at that frequency while bumps indicate more. The
audible result of the dips and bumps in the response curve will depend on the frequencies
where they occur. A bump in the upper bass may make the speaker sound boomy. A dip in the
midrange can make the speaker sound recessed
- Off-axis frequency response (15 degrees) -
Measured horizontally at 15 degrees off-axis from the loudspeaker face (2 or 3 meters).
Purpose: Measures output of loudspeaker at 15 degrees from the center position
across the audible frequency spectrum. This mimics the sound that you would get at your
listening position with the speakers toed-in somewhat, but not directly aimed at your
ears.
What it tells you: Ideally this should be very close to the on-axis response, although
it will likely vary downward, particularly at higher frequencies. Speakers that have
off-axis frequency response that matches the on-axis response are said to have good
dispersion characteristics.
- Off-axis frequency response (30 degrees):
Measured horizontally at 30 degrees off-axis from the loudspeaker face (2 or 3 meters).
Purpose: Measures output of loudspeaker at 30 degrees from the center position
across the audible frequency spectrum. This measurement is useful for predicting how
strong the early reflections from the side walls of the room will be. There will
likely be more high frequency roll off than the 15-degree off-axis measurement, but the
curves should complement each other and not vary radically.
What it tells you: Like the 15-degree response, this one should ideally be close in
shape to the on-axis response. However, this one will likely be lower than the 15-degree
response. Like all response measurements one should look examine the bandwidth and the
smoothness of the response across that range. If the off-axis response at 30 degrees is
very close to the on-axis response the speaker would be considered as having excellent
off-axis response.
- Sensitivity - Averaged response from 300Hz
to 3kHz for input signal of 2.83V.
Purpose: Expresses the output level of the loudspeaker with standard input voltage.
What it tells you: How much power will be needed to drive the speaker to achieve any
given listening level. A sensitivity of 92dB and above is relatively high, so the
speakers will require less power for any given listening level, while a sensitivity of
85dB and below is low, which means the speaker will require more amplifier power for the
same listening level as the
more sensitive speaker. Sensitivity does not correlate with speaker quality and should
only be used to determine how much amplifier power one will need to drive a speaker to
sufficiently loud levels.
| Chart 2 - Listening Window |
- Listening window - Averages five frequency
response measurements and plots them as a single frequency response. The five frequency
response measurements that are averaged for the Listening Window are: on-axis, 15 degrees
left and right off-axis, 15 degrees up and down off-axis.
Purpose: Gives increased perspective of on-axis loudspeaker response in listening
position. Takes into account subtle variations of on- and off-axis response on both the
horizontal and vertical plans.
What it tells you: Averaging multiple measurements is important because subtle
frequency response changes occur in small increments on- and off-axis, both laterally and
vertically. This measurement is especially useful because it allows for small variations
in the listening position and ear height and can be a more useful determinant of
real-world listening than the standard on-axis measurement. Like any frequency response
one should take note of the bandwidth (the upper and lower frequencies the speaker extends
to), as well as the smoothness of the response across all frequencies. Dips in response
mean a speaker is "less-loud" at that point, while peaks mean it is
"louder" (i.e., more sound energy). Depending on the frequency it may
result in a more distant or forward quality.
| Chart 3 - Total Harmonic
Distortion + Noise (THD + N) |
- THD+N variation with frequency at 90dB -
Measured at 2 meters (equivalent to 96dB at 1 meter) from 50Hz to 10kHz. The top curve of
the chart shows the frequency response of the loudspeaker at the determined SPL level (i.e.,
90dB) while the bottom curve shows the distortion component of the signal (values below
40dB should be ignored because they are too close to the noise floor of the test equipment
to be of use).
Both curves are reported in dB which can be read off the vertical axis. In order to
convert to a percentage one must read the top line (frequency response) and then determine
the dB difference between that line and the bottom line (THD+N line). Translation from dB
to % is as follows:
Equal (or 0dB difference) = 100 %
-10dB = 31.6%
-20dB = 10.0%
-30dB = 3.16%
-40dB = 1.0%
-50dB = <0.5%
Please note: an SPL level of 90dB measured anechoically is very loud and
considered far beyond normal listening levels, particularly for small loudspeakers. To
give more information for real-world listening levels, if it appears that the speaker is
being strained beyond its output abilities at this level we will provide a second
measurement at at lower SPL (the SPL level will be printed with the chart).
Purpose: Measures THD+N output at discrete frequency intervals for above-normal
listening levels. Please note that 90dB output at a 2-meter distance is equivalent to an
SPL level of 96dB at a 1-meter distance.
What it tells you: Audibility of distortion varies as to type of distortion and
also the frequency at which it is occurring. Distortion measurements for loudspeakers are
usually many times that of electronics (i.e., amplifiers, receivers, etc.).
Furthermore, certain types of distortions are more audible than others and the audibility
of that also depends on the frequency. Our distortion measurements give a general
indication of how much distortion is occurring for a given output level at above normal
listening levels. Distortion levels will be less (sometimes much less if the speaker is
being stressed beyond capabilities at 90dB) at lower SPLs.
| Chart 4 - Deviation from
Linearity |
- Deviation from linearity -
Measured with a frequency sweep across the audible spectrum on axis at 2 meters.
Purpose: Shows how a speaker is stressed and if it compresses at certain
frequencies as the sound-pressure level is increased.
What it tells you: As volume increases, all frequencies should rise at the
same rate. However, as a speaker is stressed, compression will occur at certain
frequencies. The stress may be mechanical, thermal or otherwise. This test shows
those frequencies at which deviation occurs as a result of compression. Many speakers show
slight deviations at 90dB. Most speakers start to show serious deviations at 95dB. Very
few speakers can be tested at 100dB without damage.
Please note: We began producing this measurement in early 2006. Before
that time, Chart 4 was for Impedance Magnitude Variation With Frequency.
| Chart 5 - Impedance
Magnitude Variation with Frequency |
- Impedance magnitude variation with
frequency - Measured across audible frequency spectrum.
Purpose: Measures impedance at discrete frequency intervals to indicate
load placed on amplifier to drive the loudspeaker.
What it tells you: In general, the lower the impedance is the harder it
will be for the amplifier to supply enough power to properly drive the loudspeaker. The
larger the peaks are in the impedance chart, the more difficult the loudspeaker load is
and the more control the amplifier will need to have over the loudspeaker to get good
optimum sound. The easier the loudspeaker load, the flatter the impedance plot will be and
the closer to 8 ohms it will stay. There is no one thing in the impedance curve that tells
the entire story of how difficult the loudspeaker load will be, however, in general, there
are a couple things to look at including: 1) The minimum impedance levels (in particular,
take note of frequencies below 200Hz which many consider harder to drive than the same
impedance at higher frequencies), and the size of the narrow peaks in impedance.
Many stereo and A/V receivers have the smallest power supplies on a watt-per-channel basis
so they tend to perform best when connected to loudspeakers which do not go below 6 ohms
and do not have large prominent impedance spikes. Many tube amplifiers also benefit from
avoiding loudspeakers with large impedance peaks. Occasionally there may be speakers for
special applications, like high sensitivity loudspeakers for low powered tube amplifiers
where the loudspeaker intentionally has an impedance higher than 8 ohms. This will likely
be discussed in those reviews.
Please note: This measurement was labeled as Chart 4 for sets of
measurements produced before early 2006.
|
![[SoundStage!]](titles/sslogo3.gif) Home Audio
Home Audio